
Compute Daily Particulate Matter (PM2.5) Predictions for Europe Using Machine Learning
A space-time extremely randomised trees model was used to estimate PM2.5 concentrations over Europe. Satellite remote sensing data, meteorological data, and land variables were used as the independent variables, PM2.5 ground-observations were used as the dependent variable to create our model. Used data is shown in Table 1.
| Name of the variable | Unit |
| PM2.5 | μg/m3 |
| Aerosol optical depth | – |
| PBLH | m |
| WS | m/sec |
| T2m | K |
| Relative Humidity | % |
| Total precipitation | mm |
| Total Column Water Vapour | Kg/m2 |
| NDVI | – |
| Evaporation | mm |
| Elevation | m |
The model achieved good results with out of sample cross validated R2 of 0.69, RMSE of 5 μg/m3 and MAE of 3.3 μg/m3. Other validation methods were applied as shown in Table 2.
| 10-CV | R2 | RMSE | MAE |
| Sample-based | 0.69 | 5.0 | 3.3 |
| Spatial | 0.69 | 4.9 | 3.2 |
| Temporal | 0.53 | 6.1 | 4.1 |
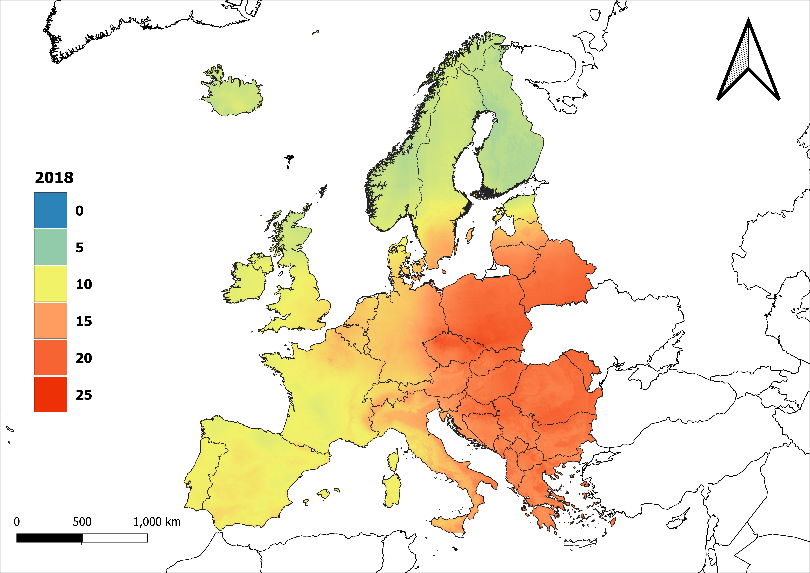
The outcome of this study is a daily full coverage PM2.5 dataset with 1 km spatial resolution for a three-year period 2018–2020.
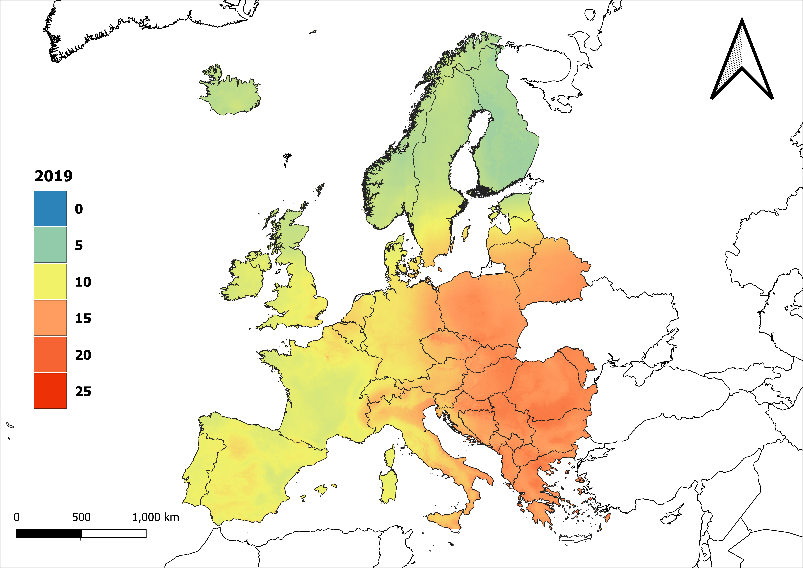
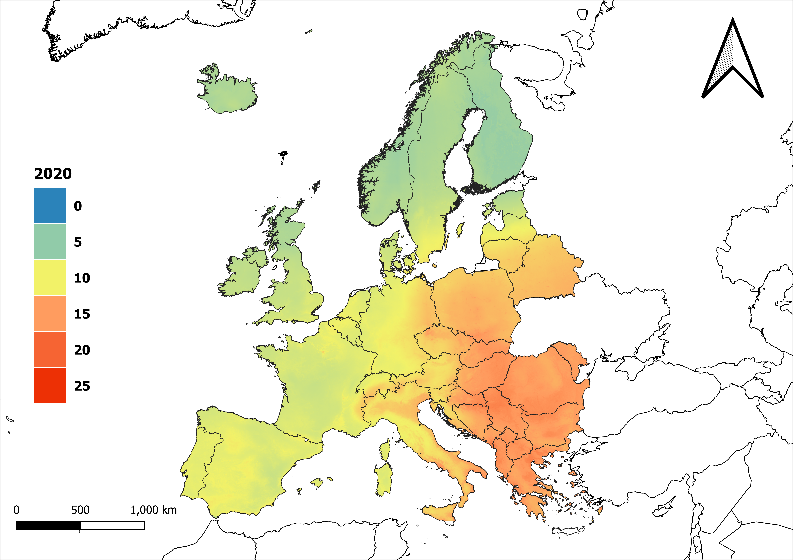
Figure 1 The average PM2.5 for the years 2018, 2019, and 2020 over Europe.
We selected November 2020 for downloading demonstration data, the same principle applies to the remaining months by changing the month and the year in the links.
![]()