Output 3.c: Seamless environmental quality maps, climate change indicators, and potential natural vegetation
Prepared by: OpenGeoHub, CTU in Prague, mundialis and Terrasigna
Executive summary
Environmental quality maps
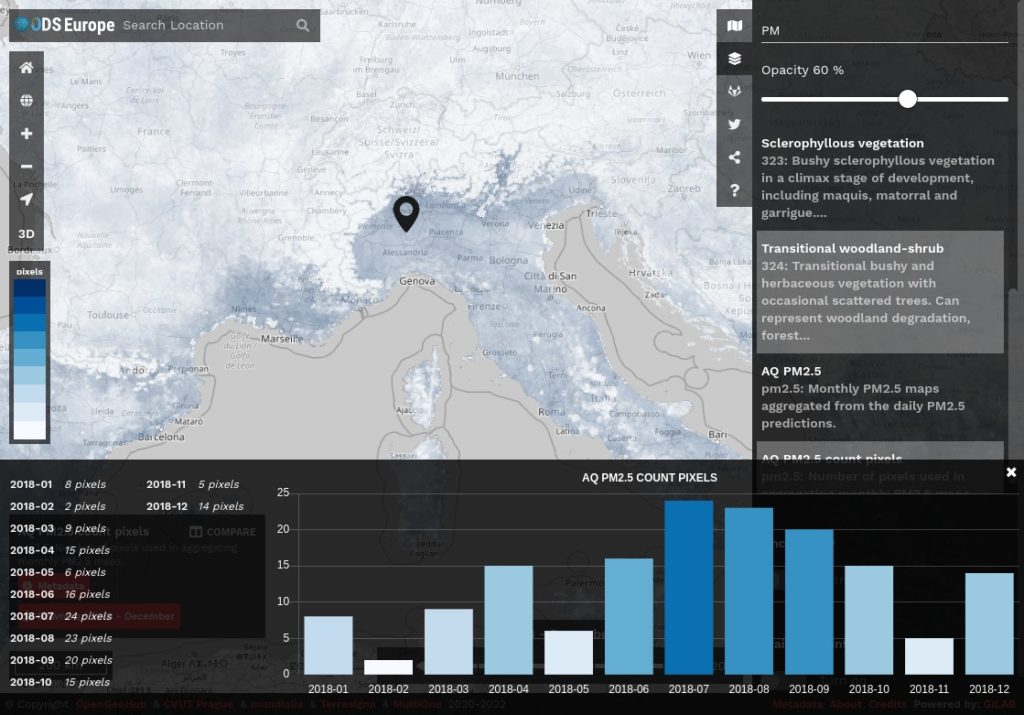
Seamless environmental quality maps related to milestone 7 are currently represented by Monthly Particulates (PM2.5) Predictions computed using Machine Learning for years 2018-2020.
We have prepared the following list of layers:
- PM2.5 monthly maps for the year 2018
- PM2.5 monthly maps for the year 2019
- PM2.5 monthly maps for the year 2020
The layers were prepared at 1-km spatial resolution. All processing was implemented using Python in combination with GDAL and GRASS GIS.
All layers are available publicly as Cloud-Optimized GeoTIFFs for download and via the ODS-Europe Viewer. For more information contact: Saleem Ibrahim (CVUT Prague).
Climate change indicators
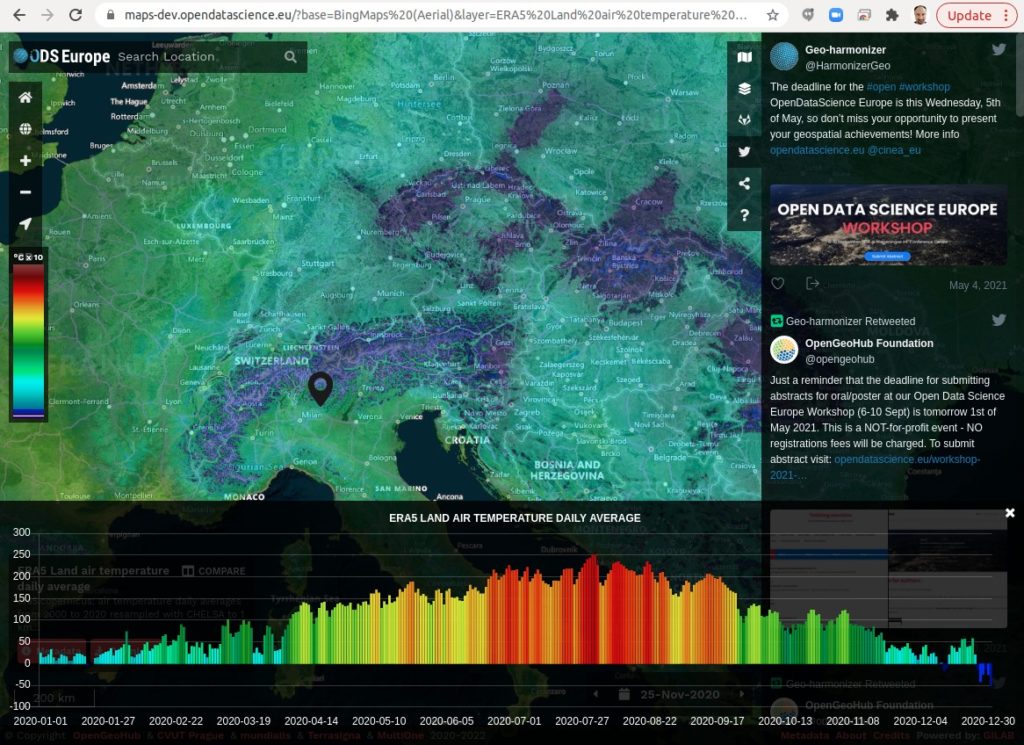
The objective of our reprocessing efforts has been to aggregate selected ERA5 Land hourly datasets (period: 2000–2020, DOI) to daily data while increasing the resolution from the native ERA5 resolution of 0.1 degree to 30 arc-sec by using auxiliary data (CHELSA, Karger et. al, 2020, DOI). The original ERA5 data are available from the Copernicus Climate Data Store (CDS). We have processed air temperature 2 meter above ground, surface temperature and precipitation. All data were first aggregated in time to obtain for temperatures daily minimum, mean, and maximum and for precipitation the daily sum. Spatial resolution was enhanced to 30 arc seconds with the help of CHELSA climatology. For each day we used the corresponding monthly long-term average of CHELSA. The aim was to use the fine spatial detail of CHELSA and at the same time preserve the general regional pattern and fine temporal detail of ERA5 Land. The steps included aggregation and enhancement, specifically:
ERA5 Land temperature data:
- spatially aggregating CHELSA to the resolution of ERA5 Land,
- calculate difference of ERA5 Land – aggregated CHELSA,
- interpolate differences with a Gaussian filter to 30 arc seconds,
- add the interpolated differences to CHELSA,
ERA5 Land precipitation data:
- spatially aggregating CHELSA to the resolution of ERA5 Land,
- calculate proportion of ERA5 Land / aggregated CHELSA,
- interpolate proportion with a Gaussian filter to 30 arc seconds,
- multiply the interpolated proportions with CHELSA,
Using proportions ensures that areas without precipitation remain areas without precipitation. Only if there was actual precipitation in a given area, precipitation was redistributed according to the spatial detail of CHELSA. The resulting dataset is now available via the ODS-Europe viewer (see below). For more information contact: Markus Metz (Mundialis).
Fire disturbance and flood events
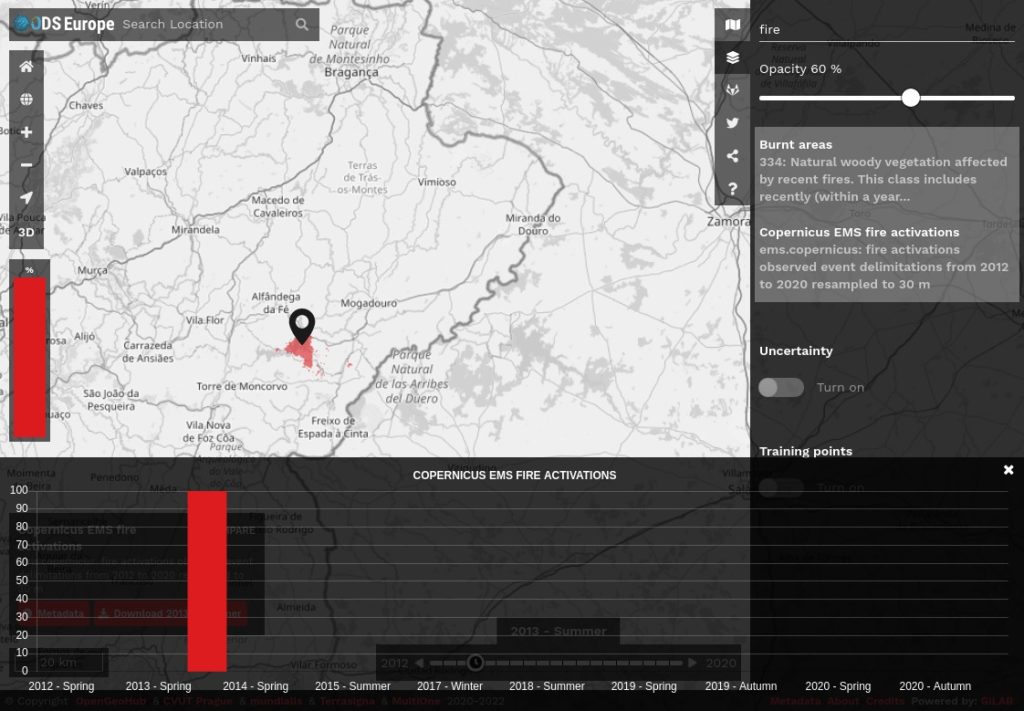
Fire disturbance indicator includes 2 products in this release: (1) 109 fire activations mapped by the Copernicus Emergency Rapid Mapping Service: individual downloaded, rasterized and mosaicked per year and season, resampled at 30-m and (2) MODIS MCD64A1 collection 6 Burned Area Monthly aggregated by season, mosaicked for the Geo-harmonizer region (window 8 and 22) and resampled to 250m. Thus, the product based on EMS covers the period 2012–2020 and the one based on MCD64A1: winter 2000–2020.
The flood events indicator includes one product in this release: (123) flood activations mapped by the Copernicus Emergency Rapid Mapping Service: individual downloaded, rasterized and mosaicked per year and season, resampled at 30m. The temporal extent is 2012–2020. For more information contact: Codrina M. Ilie (TerraSigna).
Actual and Potential Natural vegetation
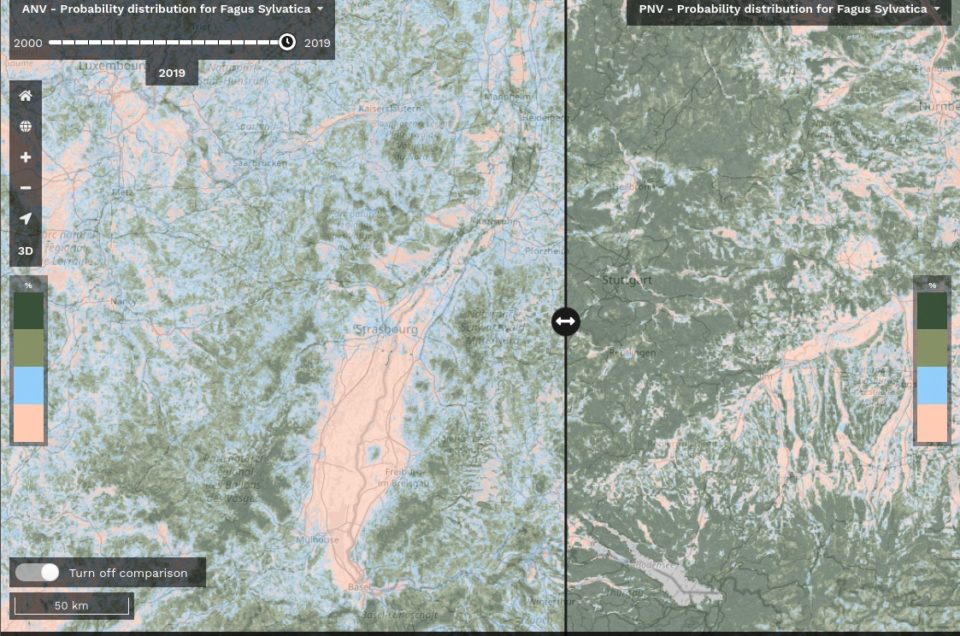
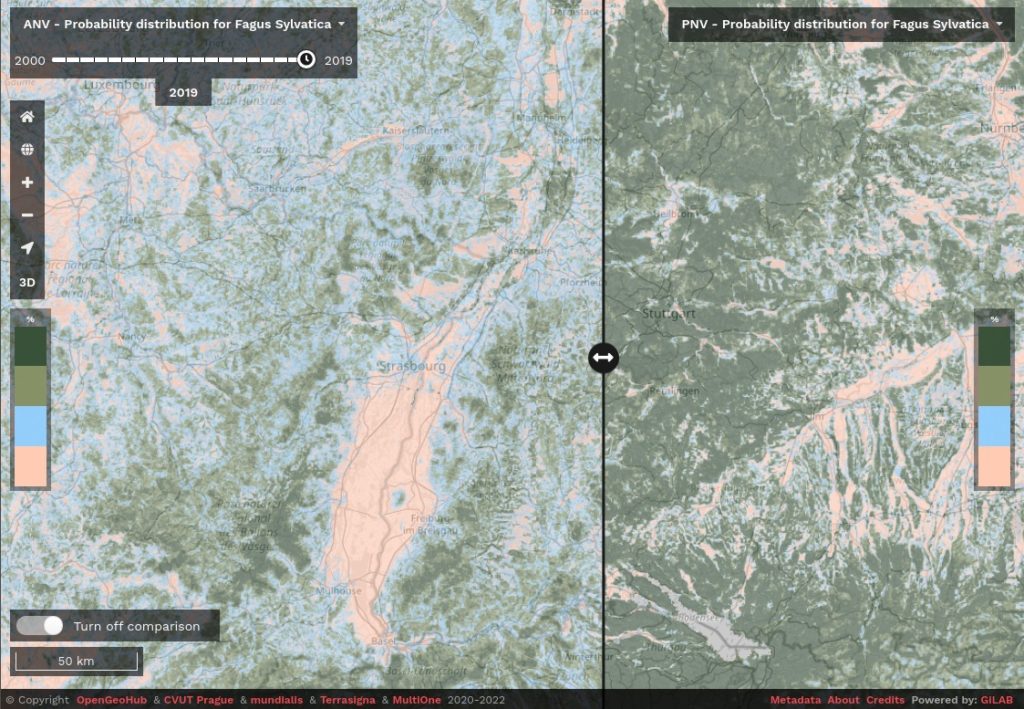
Predictions of distribution (probability of occurrence) for 10 target forest species from the European Forest Atlas were produced for the period 2000–2020 and at 120-m spatial resolution. Predictions include actual distribution of forest tree species and their potential distribution for the most recent year (2019). Users can put maps of actual vs potential distribution next to each other and visualize gaps in data. Some artifacts in predictions are currently being filtered out (due to missing values in some input layers) and final maps will be made publicly available via the ODSE-viewer in the coming weeks. Fore more information contact: Carmelo Bonannella (OpenGeoHub).
![]()


